Home Blog Page 518

Scientists Produce 3D Maps Of Oxygen-Deprived ‘Dead Zones’ In Pacific Ocean

0

In this image showing the intensity of oxygen-deficient zones, copper colors represent the lowest oxygen concentrations in the eastern Pacific Ocean, while deep teal indicates regions without low oxygen. (Jarek Kwiecinsky, Andrew Babbin, MIT)


By Martin M Barillas

Scientists have used new methods to create 3D maps of large oxygen-deficient zones (ODZs) in the Pacific Ocean. These naturally occurring zones can limit marine ecosystems and fisheries, and are a source of nitrous oxide, a greenhouse gas.


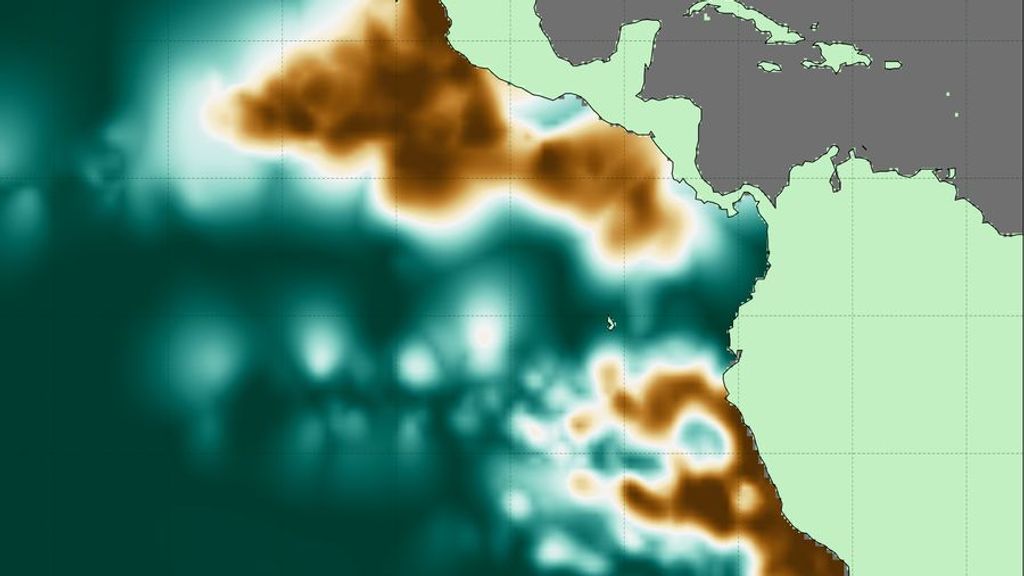
Scientists at the Massachusetts Institute of Technology (MIT) produced an atlas of the largest of these desolate areas in the tropical Pacific. They show not only the ODZs’ volume, extent and depth but also things on a finer scale such as streams of healthier, oxygenated water that enter areas nearly devoid of life-giving oxygen.

“It’s broadly expected that the oceans will lose oxygen as the climate gets warmer. But the situation is more complicated in the tropics where there are large oxygen-deficient zones,” said researcher Jarek Kwiecinski, who developed the atlas with Professor Andrew Babbin, an MIT marine biogeochemist.

When marine microbes consume plankton, they also gobble up available suspended oxygen in affected areas. These oxygen-deficient zones are well away from passing currents, which would normally oxygenate them, and become more or less permanent in their locations, at mid-ocean depths of about 115 to 3,280 feet below the surface.

“It’s important to create a detailed map of these zones so we have a point of comparison for future change,” Kwiecinski said.

“This gives you a sketch of what could be happening,” he said, adding that the study offers data that may reveal how oxygen in the oceans is controlled.

Jarek Kwiecinski (standing, left) and Andrew Babbin (center, in purple) with members of the MIT research team they led in producing a 3D atlas of the largest oxygen-deprived areas in the tropical Pacific Ocean. (Mary Lide Parker)

“How the borders of these ODZs are shaped and how far they extend could not be previously resolved,” said Babbin, who pointed out that research afforded a better idea of the extent and depth of the ODZs.

Relying on nearly 15 million measurements collected over more than 40 years by research cruises and autonomous robots, the MIT researchers generated 3D maps of the ODZs at various depths that can be depicted as slices. From the maps, they estimated the total volume of the two biggest dead zones in the world’s largest ocean. One extends from the western coast of South America out about 144,000 cubic miles. The other dead zone, near Central America, is nearly three times larger.

The researchers see the atlas as a reference point so that they can track changes over time. Their study appeared in the journal Global Biogeochemical Cycles.

For more than four decades, researchers have taken samples of seawater with plastic Niskin bottles at various depths to measure oxygen levels. “But there are a lot of artifacts that come from a bottle measurement when you’re trying to measure truly zero oxygen,” Babbin said. “All the plastic that we deploy at depth is full of oxygen that can leach out into the sample. When all is said and done, that artificial oxygen inflates the ocean’s true value.”

For better results, the MIT team used data from sensors on the outside of bottles or from robots cruising at various depths. These sensors continuously measure the intensity of light released by a photosensitive dye to calculate dissolved oxygen levels or changes in electrical currents as they descend.

Niskin bottles capable of collecting water at depth are lowered into the ocean to make continuous oxygen measurements. (Mary Lide Parker)

Taking measurements accurately, especially when concentrations are near zero, has become especially difficult. “We took a very different approach, using measurements not to look at their true value but rather how that value changes within the water column,” Kwiecinski said. “That way we can identify anoxic [oxygen-depleted] waters, regardless of what a specific sensor says.”

When their sensors showed a constant, low value for oxygen throughout a vertical column of the ocean, regardless of the true value, the researchers concluded that this meant that oxygen had zeroed out, designating an oxygen-deficient zone. “We can now see how the distribution of anoxic water in the Pacific changes in three dimensions,” Babbin said.

He and the team found that ODZs are more concentrated near their center but appear to peter out at the edges. “We could also see gaps, where it looks like big bites were taken out of anoxic waters at shallow depths,” Babbin said. “There’s some mechanism bringing oxygen into this region, making it oxygenated compared to the water around it.”

Edited by Richard Pretorius and Kristen Butler

Recommended from our partners


The post Scientists Produce 3D Maps Of Oxygen-Deprived ‘Dead Zones’ In Pacific Ocean appeared first on Zenger News.

Celebration of Life for Maxine McNair, mother of girl killed in Birmingham church bombing

0
Maxine McNair with her daughter, Denise, who was killed at age 11 in the 1963 bombing of Birmingham's 16th Street Baptist Church. (CONTRIBUTED)

 By Barnett Wright

The Birmingham Times

‘Be my wife and make me the happiest man on earth’

0

BY JE’DON HOLLOWAY-TALLEY

Special to the Birmingham Times

Mixed Bag For Outlook On Gas Prices

0

Travel club AAA listed a national average retail price of $3.29 for a gallon of regular unleaded gasoline on Tuesday, but although prices may be softening in the short term, analysts don't expect it to last. (Justin Sullivan/Getty Images)


By Daniel James Graeber

Gasoline prices may be softening in the short term and could be on pace for lower trends relative to last year, but don’t expect any major discounts at the pump, analysts told Zenger.


Travel club AAA listed a national average retail price of $3.29 for a gallon of regular unleaded gasoline on Tuesday. The national average is distorted somewhat by elevated prices on the West Coast, where California drivers are paying around $4.65 per gallon, but in general terms, gasoline prices are indeed at multi-year highs.

Holiday travel was snarled by pandemic-related staff shortages at major airlines, resulting in thousands of canceled flights across the country. Air travel has recovered since the pre-vaccine stage of the pandemic, but remains suppressed relative to 2019.

Data from the U.S. Transportation Security Administration show air travel is still below pre-pandemic levels, though more people may have hit the road this holiday due to canceled flights. (Transportation Security Administration)

A major snowstorm, meanwhile, caused major traffic issues on the East Coast, with hundreds of motorists stranded on the roads of Virginia. Parts of the Great Lakes region can expect about a foot of snow over the next few days and that should eat into demand this week. In general, demand can be a bit subdued after the holiday season, though with airlines stalled, travelers may still be willing to take the risk for long trips.

Demand is still at the very least close to pre-pandemic levels. Matthew Kohlman, an associate director for refined products pricing at S&P Global Platts, said refineries are still running hot in an effort to keep pace with demand.

“People are moving around more now, almost to pre-pandemic levels for driving. Trucking also remains strong,” he told Zenger. “Production is healthy, with refinery run rates over 90 percent. But inventories remain below five-year averages and companies are still racing to meet current demand rather than trying to fill storage.”

Patrick DeHaan, the senior petroleum analyst at GasBuddy, said recent demand for road fuels is actually a bit low, but it’s unclear if that’s because of the pandemic or if people are lying low after the holidays. But for DeHaan, the pandemic could be a bit of a blessing in disguise.

“I feel Omicron continues to give us breathing room — lowering demand while supply continues to catch up,” he said. “This plays nicely into what I expect to be broader relief from high prices later in 2022.”

The U.S. Department of Energy in a mid-December report said it expected retail prices to move further away from recent highs. The national average is expected to move closer to the $3.00 per gallon range this month and chart $2.88 per gallon on average for the year, according to federal estimates.

The U.S. Energy Information Administration sees prices at the pump flattening out, but still at multiyear highs. (U.S. Energy Information Administration)

But Phil Flynn, a senior energy analyst at The PRICE Futures Group in Chicago, said he’s not expecting relief at the pump any time soon. Demand is holding up and refineries are still struggling to keep up.

“If this is any indication, we could see gasoline demand as well as gasoline prices break records in the new year,” he said.

Edited by Kristen Butler

Recommended from our partners


The post Mixed Bag For Outlook On Gas Prices appeared first on Zenger News.

‘Dangerous’ Experiment Simulated Sun In A Lab

0

A plasma ejection is seen during a solar flare. Immediately after the eruption, cascades of magnetic loops form over the eruption area as the magnetic fields attempt to reorganize. (NASA/SDO and the AIA, EVE and HMI science teams)


By Martin M Barillas

The sun’s core and corona both reach millions of degrees, but in between, its surface is a comparatively cold 11,000 degrees (6,000 C). That mystery led researchers to simulate solar conditions in a potentially “dangerous” experiment.


Temperatures at the center of the sun reach an incomprehensible 27 million degrees (15 million Celsius) but drop at the surface, where it emits light.

“It is all the more astonishing that temperatures of several million degrees suddenly prevail again in the solar corona above,” said researcher Frank Stefani of the Helmholtz Center Dresden-Rossendorf (HZDR), a national lab in Germany.

Stefani and his team at the HZDR Institute for Fluid Dynamics conducted experiments to understand corona heating. For Stefani, the question is: “Why is the pot warmer than the stove?”

While scientists had generally accepted that magnetic waves have an essential role in heating the solar corona, there was disagreement over whether it was due to change in the magnetic field structures in the solar plasma or to the dampening of different types of waves.

The Dresden researchers focused on the solar atmosphere immediately below the corona, or magnetic canopy, where plasma waves, known as Alfvén waves, and magnetic fields heat the plasma and the solar corona above.

Flaring, active regions of the sun are highlighted in this image combining observations from several telescopes. High-energy X-rays from NASA’s Nuclear Spectroscopic Telescope Array (NuSTAR) are shown in blue; low-energy X-rays from Japan’s Hinode spacecraft are green; and extreme ultraviolet light from NASA’s Solar Dynamics Observatory (SDO) is yellow and red. (NASA/JPL-Caltech/GSFC/JAXA)

“Just below the sun’s corona lies the so-called magnetic canopy, a layer in which magnetic fields are aligned largely parallel to the solar surface. Here, sound and Alfvén waves have roughly the same speed and can therefore easily morph into each other,” Stefani said. “We wanted to get to exactly this magic point — where the shock-like transformation of the magnetic energy of the plasma into heat begins.”

To find the answer, Stefani and his team used dangerous molten rubidium, an alkali metal, and pulsed it with high magnetic fields.

Rubidium reacts violently to water and bursts spontaneously into flame when exposed to air. By putting it in a stainless steel container and exposing it to 50 times atmospheric air pressure, the researchers safely melted the rubidium by exposing it to a magnetic field and alternating current.

The laboratory model confirmed experimentally for the first time the theoretical behavior of Alfvén waves. The results were published in the Physical Review Letters of the American Physical Society.

The researchers likened the magnetic fields’ effect on the ionized particles of the plasma to a guitar string. Just as playing that string triggers a wave motion, the frequency and speed of the Alfvén wave increase with the strength of the magnetic field.

The Alfvén waves were measured at more than 1 million times the strength of Earth’s magnetic field and changed to a lower frequency, breaking the sound barrier for the first time. This doubling of the period accorded with Stefani’s predictions.

Alfvén waves were first predicted in 1942, having been detected in liquid-metal experiments and studied in plasma physics labs. Until now, the conditions of the sun’s magnetic canopy that produce corona heating had not been reproduced in a lab.

Both NASA’s Parker Solar Probe and the European Space Agency’s Solar Orbiter are seeking to know more about these effects by entering into closer contact with the sun.

Edited by Richard Pretorius and Kristen Butler

Recommended from our partners


The post ‘Dangerous’ Experiment Simulated Sun In A Lab appeared first on Zenger News.

Scientists Develop Method To Harvest Electricity From Seaweed

0

The humble seaweed can become a significant carbon-neutral energy solution, according to a recent study. (Joe Whalen, Tampa Bay Estuary Program/Unsplash)


By Naama Barak

Ancient Greek inventor Archimedes may have had his Eureka moment in the bath, but modern-day Israeli student Yaniv Shlosberg recently had his own moment of clarity during a swim in the sea.


Inspired by the sight of seaweed on a rock, he wondered whether the algae could be used to create green, carbon-negative energy. A bit of research and one publication later, the answer became a resounding yes.

The negative effects of fossil fuel usage have long led researchers to look for cleaner, planet-friendlier ways to provide the world with power. One such path of research involves using living organisms as the source of electrical currents in microbial fuel cells, but the problem with this is that the bacteria need to be constantly fed and in some cases are pathogenic.

Another option is a technology called Bio-PhotoElectrochemical Cells (BPEC), where the source of electrons can be derived from photosynthetic bacteria, especially cyanobacteria, or blue-green algae.

In an aerial view, blooms of cyanobacteria, also called blue-green algae, turn the water green in Clear Lake at Redbud Park on Sept. 26, 2021, in Clearlake, California. (Justin Sullivan/Getty Images)

The only problem here is that it is less commercially attractive, since the amount of current that can be produced is smaller than that of other sources such as solar cell technologies.

“I had the idea one day when I went to the beach,” explains Shlosberg. “At the time I was studying the cyanobacterial BPEC, when I noticed seaweed on a rock that looked like electrical cords. I said to myself — since they also perform photosynthesis, maybe we can use them to produce currents.”

Shlosberg and a team of researchers from the Technion – Israel Institute of Technology and the Israel Oceanographic and Limnological Research Institute began exploring the use of Ulva, or sea lettuce, which grows plentifully both naturally and for research purposes on Israel’s Mediterranean shores.

After developing new methods to connect between the Ulva and the BPEC, currents 1,000 times greater than those from cyanobacteria were obtained — currents that are on the level of those obtained from standard solar cells.

One of the Ulva growth vats at the Israel Oceanographic and Limnological Research Institute in Haifa. The vat is near the beach and fresh seawater continuously flows through the system. (Courtesy of the Technion Spokesperson’s Office)

The results were recently published in Biosensors and Bioelectronics.

Currents in the dark

The researchers note that the increased currents produced by Ulva are due to the high rate of seaweed photosynthesis and the ability to use the seaweed in their natural seawater as the BPEC electrolyte — the solution that promotes electron transfer in the BPEC.

In addition, the seaweed can also provide currents in the dark thanks to a process of respiration whereby sugars produced in the photosynthetic process are used as an internal source of nutrients.

Not only is this new method carbon-neutral, but is in fact “carbon negative,” with the seaweed absorbing carbon from the atmosphere during the day while growing and releasing oxygen.

No carbon is released during the harvesting of the current during daytime, and the seaweed releases the normal amount of carbon during respiration at night.

The researchers have so far built a prototype device that collects the current directly in the Ulva growth vat and believe that it can be further improved and developed as a future green energy solution.

“It is a wonder where scientific ideas come from,” Shlosberg says.

Produced in association with ISRAEL21c.

Recommended from our partners


The post Scientists Develop Method To Harvest Electricity From Seaweed appeared first on Zenger News.

Here Are Some Steps That Might Help Birmingham Curb Crime, According To Citizens

0
"JROTC in Birmingham schools can help instill discipline," says one resident.

By Haley Wilson

The Birmingham Times

Nitty Gritty On Our Ancestors: How Scientists Are Recovering Human DNA From 2,000-Year-Old Head Lice

0

A mummy of the Ansilta people of the Andes Mountains had head lice that cemented nits to hair, encasing DNA that offers clues about human migration 1,500 to 2,000 years ago. (Courtesy San Juan National University, Argentina)


By Martin M Barillas

Scientists have revealed important data about the ancient Americas by extracting DNA preserved by head lice thousands of years ago on South American mummies.


For the first time, researchers have extracted human DNA from the cement head lice use to attach their tiny nits, or eggs, to human hair. An international team recovered DNA from mummified remains found in Argentina and dated to 1,500 to 2,000 years ago, and it is of much better quality than DNA obtained by other methods.

“Like the fictional story of mosquitos encased in amber in the film ‘Jurassic Park’ carrying the DNA of the dinosaur host, we have shown that our genetic information can be preserved by the sticky substance produced by head lice on our hair. In addition to genetics, lice biology can provide valuable clues about how people lived and died thousands of years ago,” said Alejandra Perotti of Reading University in England, co-author of the study published in Molecular Biology and Evolution.

“Demand for DNA samples from ancient human remains has grown in recent years as we seek to understand migration and diversity in ancient human populations. Head lice have accompanied humans throughout their entire existence, so this new method could open the door to a goldmine of information about our ancestors, while preserving unique specimens,” she said.

The “cement” used by head lice to attach their eggs to human hair can also preserve skin cells and high-quality DNA samples. (University of Reading)

The best samples of ancient DNA have typically been taken from the skull or teeth. These are sometimes unavailable, and ethical objections have been raised about disturbing ancient remains of indigenous peoples. DNA sampling can also severely damage sample tissue, preventing continued scientific analysis.

Recording DNA from nit cement offers a solution, according to the study’s authors, because it is found in the hair and on the clothing of well-preserved mummies. The nit cement samples were found to contain the same concentration of DNA as a tooth, double that of bone, and four times that recovered from blood inside far more recent lice specimens. This is because the cement left by the female lice also encased skin cells.

The mummified remains belonged to the ancient people of the Andes Mountains in the San Juan province of Argentina. The research team also examined nits found on human hair woven into an ancient textile from Chile, as well as from a shrunken head from the headhunting Jivaro people of Ecuador.

In another discovery, the earliest direct evidence of Merkel cell polymavirus was found in nit cement recovered from one of the mummies. First described in 2008, the virus is shed by human skin and may sometimes cause skin cancer. The new study shows that head lice may be a vector for the virus.

Nit of human louse showing the cement covering the egg shell and hair shaft, including a human cell (nucleus, arrow). Fluorescence microphotograph in the UV light, specimen prepared with a fluorescence dye that binds to DNA. Nuclei of cells and bacteria show signal (arrows). (University of Reading)

“The high amount of DNA yield from these nit cements really came as a surprise to us, and it was striking to me that such small amounts could still give us all this information about who these people were, and how the lice related to other lice species but also giving us hints to possible viral diseases,” said first author Mikkel Winther Pedersen, a professor at the University of Copenhagen.

The sampled DNA was able to reveal the sex of the human hosts, along with the fact that each of the deceased belong to the founding mitochondrial lineages in South America. The study also showed that the original inhabitants of San Juan were migrants from Amazonian rainforests south of modern Colombia and Venezuela.

“There is a hunt out for alternative sources of ancient human DNA and nit cement might be one of those alternatives. I believe that future studies are needed before we really unravel this potential,” Pedersen said.

Edited by Richard Pretorius and Kristen Butler

Recommended from our partners


The post Nitty Gritty On Our Ancestors: How Scientists Are Recovering Human DNA From 2,000-Year-Old Head Lice appeared first on Zenger News.